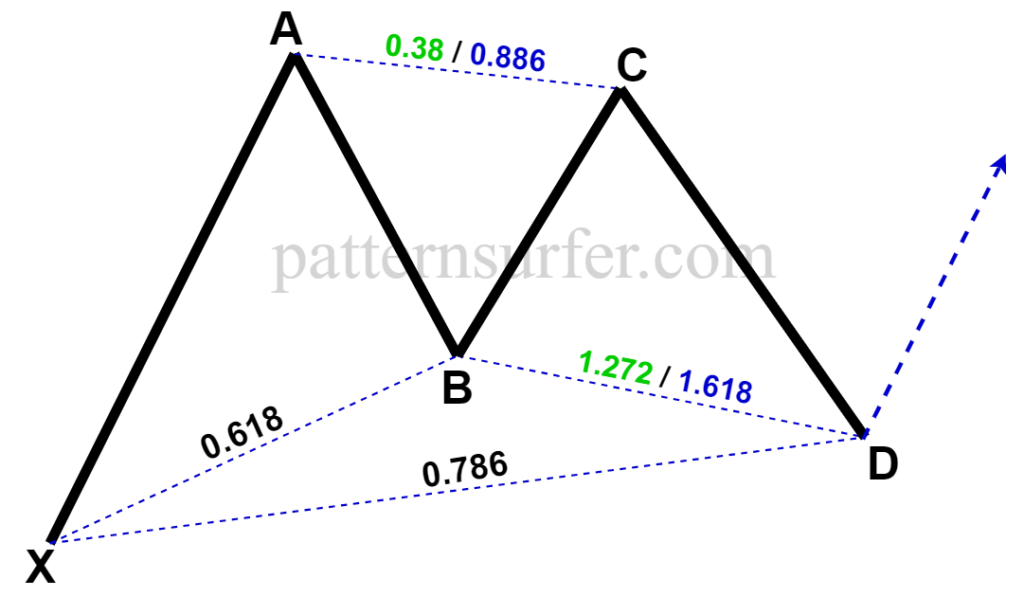
Bullish Gartley
At the completion price “D” of the Bullish Gartley, we expect a potential reversal for the price to rise.
The Bullish scenario Gartley is defined by the following Fibonacci ratios:
- Move AB is a 0.618 retracement of the first upwards impulse XA
- BC can be either (Case a) a 0.382 or (Case b) 0.886 retracement of AB
- In Case a; CD will be a retracement of 1.27 below B
- In Case b; CD will be a retracement of 1.618 below B
- CD will be a retracement of 0.786 from the original impulse origin X
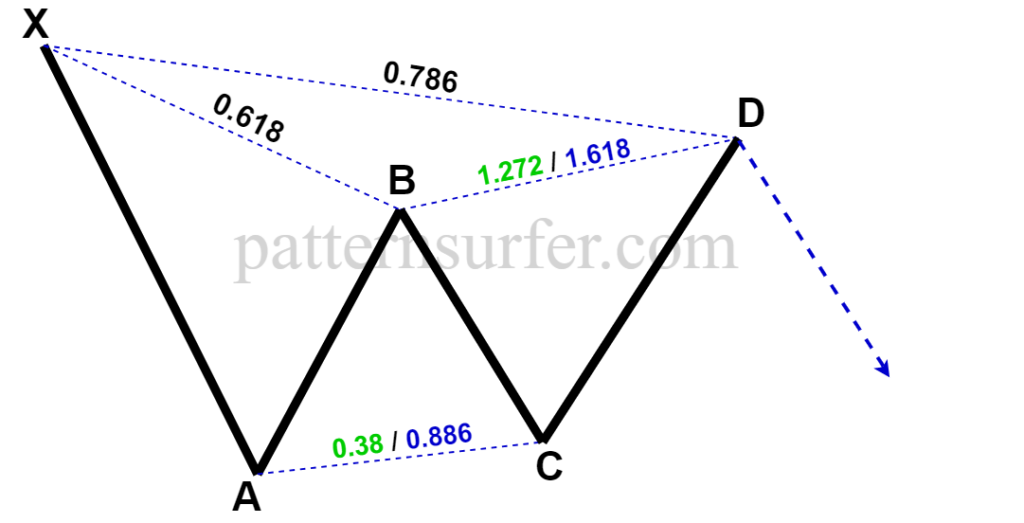
Bearish Gartley
At the completion point of the Bearish Gartley pattern, we expect a potential reversal for the price to fall.
The Bearish scenario Gartley is defined by the Fibonacci ratios of its legs:
- Move AB is a 0.618 retracement of the impulse XA
- BC can be either (Case a) a 0.382 or (Case b) 0.886 retracement of AB
- In Case a; CD will be a retracement of 1.27 above B
- In Case b; CD will be a retracement of 1.618 above B
- CD will be a retracement of 0.786 from the original impulse origin X
Gartley Pattern Identification with PatternSurfer
On arrival of a Gartley pattern, PatternSurfer will display all coordinates, including the Actual Pattern Completion Price (D) as per the market prices, as well as the Ideal Pattern Completion Price (an exact D as per the strict Fibonacci ratio). D defines the entry point for the Gartley pattern.
To maintain a profitable risk-reward ratio, the price at X can be kept as a conservative stop-loss for the trade.
With PatternSurfer, users are also able to identify the formation of a Gartley pattern before point D is reached. This is called an “Approaching” pattern, and traders will be made aware of the expected (Ideal) Completion Price, and the current Actual Completion Price which is approaching the Ideal D.